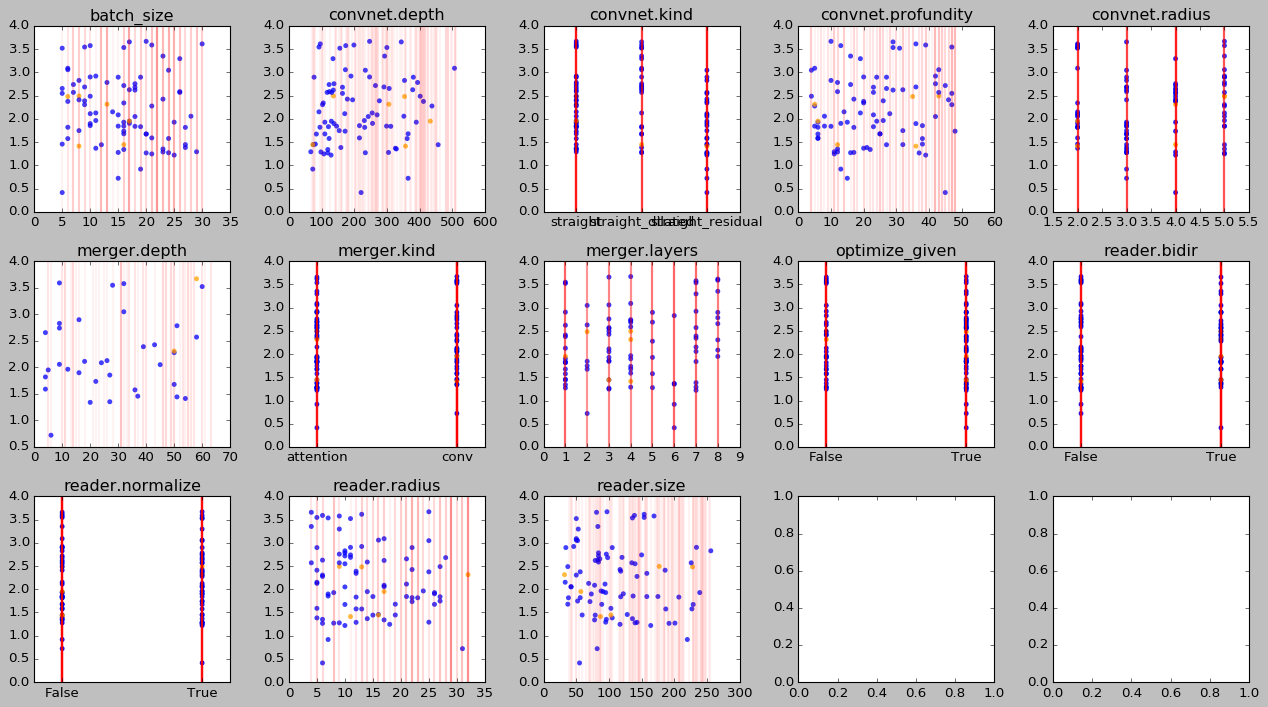
I performed a hyperparameter search over models trained with the squared EMD loss and the contiguish masking I’ve been talking about.
I used to do grid searches, but I’ve been experimenting with random search recently. The rationale is that most hyperparameters don’t matter, so changing multiple hyperparameters at a time is more efficient. I’m still working out my workflow, but for now I like scatterplots:

Each subplot corresponds to a hyperparameter. Within each subplot, the horizontal axis ranges over hyperparameter values and the vertical axis over loss values (on a log scale to get more resolution at the bottom). There are three kinds of results in each plot. Blue dots are reliable results from runs that didn’t crash or end prematurely. Orange dots show results from unfinished runs. Red lines show runs that didn’t even manage to start.
The red runs are evenly distributed over the hyperparameter space, which is good. If they were bunched up in a particular region, then that region would be underrepresented. If I silently ignored the crashed runs, I would never know about this.
Overall, I don’t see any slam dunk in terms of directions to move in to improve the loss. Three runs are ahead of the pack, but they look like outliers to me.
Legend:
convnet.depthis the number of filters andconvnet.profundityis the number of layers (Yeah I know).convnet.kindranges overstraight(as opposed to tapered or expanding or bottlenecked),straight_dilatedandstraight_residual.convnet.radiusdenotes the filter size (I should have called thisconvnet.diameter).merger.depthspecifies the number of filters for theconvmerger.merger.kindis eitherattentionwhere the convnet repeatedly attends to the embedded caption, orconvwhere the embedded caption is repeatedly projected and concatened into the convnet activations.merger.layersis the number of times at which caption information is merged into the convnet. The actual underlying hyperparameter specifies a list of layer indices at which to merge, but that’s hard to plot.optimize_givenindicates whether to optimize the loss not just for the masked-out variables but also for the variables being conditioned on. Initially I used this to get optimization off the ground but now it doesn’t seem to be necessary anymore. However, I do believe it is a good regularizer for the kinds of functions the model learns; withoutoptimize_given, the model outputs extreme values for the known variables, which makes me feel like it has learned a fragile function.reader.bidirspecifies whether the RNN processing the caption should be bidirectional or not.reader.normalizedetermines whether the RNN should be (layer-)normalized.reader.radiusindicates the filter size of the convolutions in the quasi-RNN (again, this should be calleddiameter).reader.sizeis the number of hidden units in the RNN.